Reporting
Introduction
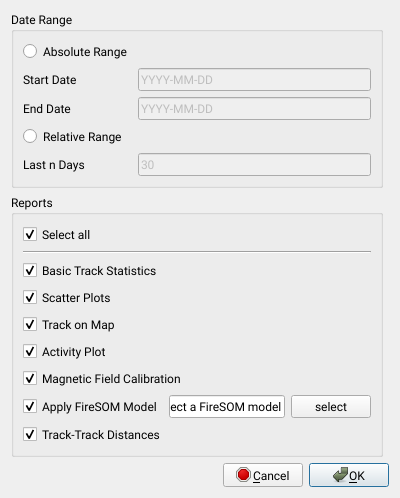
Firetail provides a reporting module, available from Report > Create Reports.
It is designed to help you to rapidly accumulate important facts about recent events for one or multiple animals.
Start by selecting individuals from the Open Files panel.
For selected individuals (checked in the Open Files panel), the reporting module computes
- basic statistics
- box plot: speed distributions
- number of GPS locations
- distance traveled
- total hours
- min/max/average/median speed
- min/max/median time delta among GPS locations
- distribution: sampling distances (GPS locations)
- orientation plot: 360 degree heading distribution
- scatterplots of pairwise event data (sensors)
- track view
- activity plot
- across individuals/tags/deployments:
- matrix of all-pairs, closest encounters
- Magnetic field calibration results
- FireSOM predictions using previously defined models
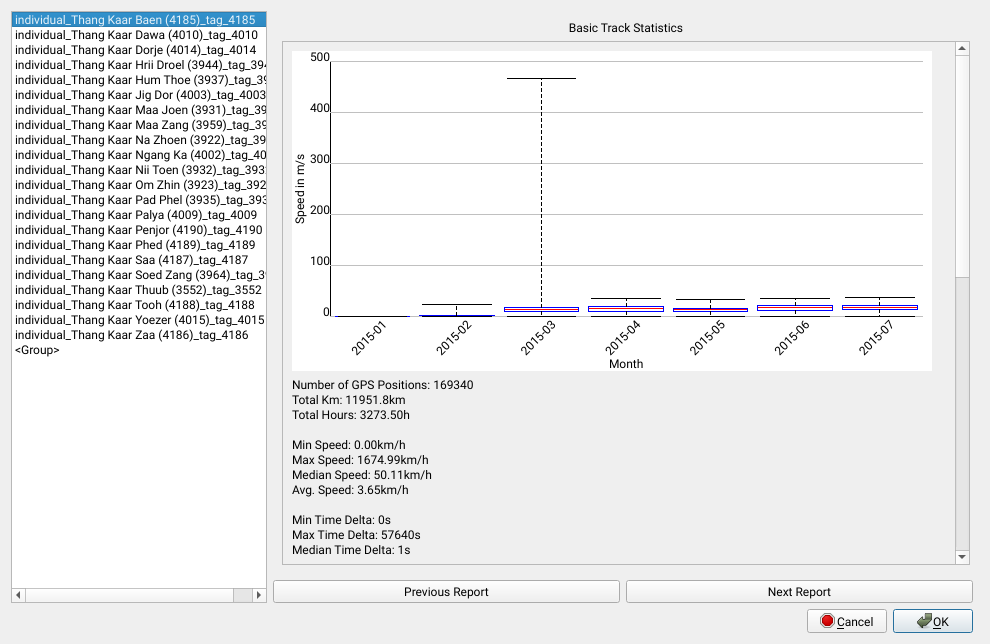
Basic Statistics
In the reporting dialog, check the basic statistics checkbox to obtain the following statistics per individual:
| statistic | description |
|---|---|
| number of GPS locations | the number of GPS locations in the given time range |
| distance traveled | the cumulative distance traveled for all individuals. Estimation from GPS locations |
| total hours | the time span covered in hours |
| min/max/average/median speed | median speed across all individuals, estimation from consecutive GPS locations |
| min/max/median time delta | minimum/maximum/median offset between consecutive GPS locations |
Hint: right-click on a plot to save it as report element image.
Speed Distribution
A box plot of past speed distributions for an individual. (See also: Quick Stats). This gives an estimate of activity in the past month (days, depending on the selected interval).
The box plot x-axis will adapt to the selected range automatically and show hours, days, weeks, months.
Sampling Time Distribution
A plot of the distribution of sampling intervals among GPS locations. A uniform distribution of intervals will be visible as a horizontal line. Shorter sampling intervals will show in the left of the plot, whereas longer intervals will appear in the right (upper) half.
GPS Heading
This plot is a histogram of the preferred heading in degrees during the monitored time range.
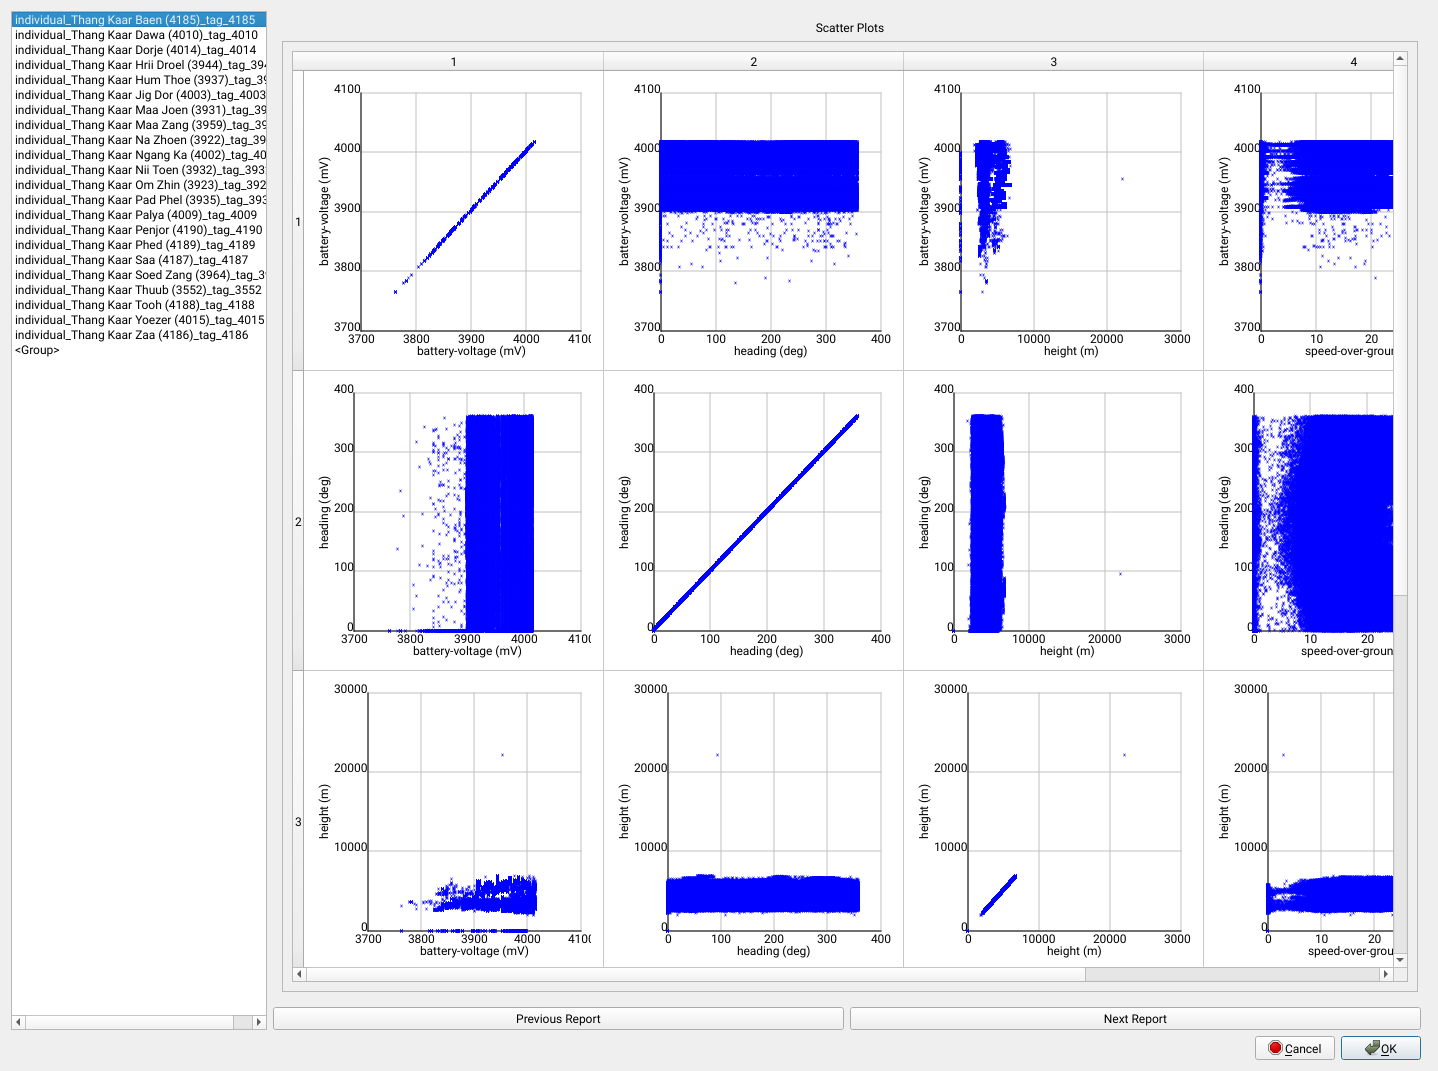
Scatterplots of Events
This provides an all-against-all view of the all pairs of event data for a tag. It can be useful to detect correlations with battery decay, height or other dependencies.
Right-click a plot to save it.
Track View
An overview of the track in the analysis interval.
Activity Plot
An activity plot for the analysis interval.
Distance Matrix
This matrix provides an overview of the
- median
- average
- minimum/maximum
distance among all pairs of tracks.
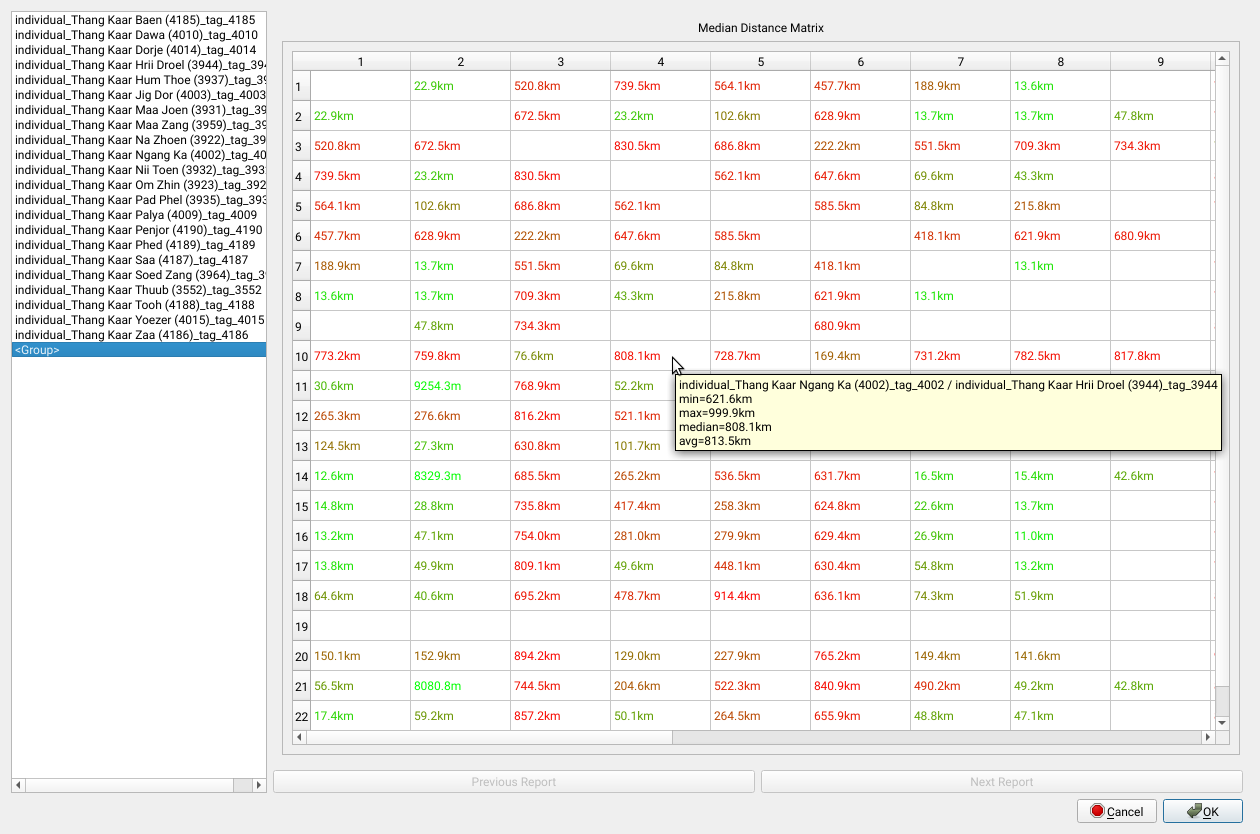
Hover a cell in the matrix to get detailed information about the entities compared and their statistics.
Magnetic field calibration
Apply a magnetic field calibration if MAG data is available and show the goodness of fit.
FireSOM predictions
Load and apply a previously defined model to each individual in the selected set. Requires acceleration data and an appropriate FireSOM model.