Data Processing
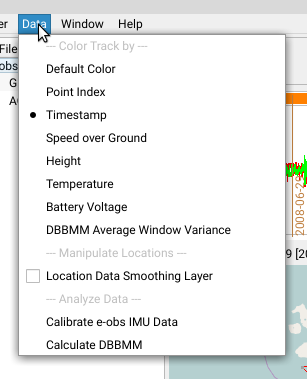
Firetail features a several data processing and data visualisation tools. You can access these features via the Data menu.
Overview
(see below for details)
| Menu Item | Category | Description |
|---|---|---|
| Default Color | Color Track by | Use the default color for the trajectory. |
| Point Index | Color Track by | Highlight timestamps by an equidistant index. Time intervals are neglected. |
| Timestamp | Color Track by | Highlight timestamps with respect to the time intervals among them. |
| Speed over Ground | Color Track by | Highlight each timestamp by measured speed over ground. |
| Height | Color Track by | Color each timestamp relative to its associated height |
| Temperature | Color Track by | Show the measured temperature for each timestamp |
| Battery Voltage | Color Track by | Show the voltage available to the tracking device for each timestamp |
| DBBMM Average Window Variance *) | Color Track by | show the track’s utility distribution calculated from a dynamic Brownian Bridge Movement Model |
| Location Data Smoothing Layer | Manipulate Locations | apply curve smoothing trajectory |
| Kernel Density Map | Analyze Data | compute heatmaps based on frequency of occurrence |
| Show Convex Hull | Analyze Data | show the minimal convex polygon around the data |
| Calibrate e-obs IMU Data | Analyze Data | calibrate Inertial Measurement Unit data for e-obs tags |
| Calculate DBBMM | Analyze Data | calculate a dynamic Brownian Bridge Movement Model |
*) Requires Calculate DBBMM
Point Index/Timestamp
In the default viewport there no indication is given whether a timestamp has been measured earlier, or later. Using point index or timestamp will visually highlight early (black) points from late (white) measurements. While the point index uses equally distributed colors along the complete track, the timestamp mode will scale the colors according to their distance.
Speed/Height/Temperature/Battery Voltage
The respective attribute is color-coded by its maximal (white) and minimal (black) values for each timestamp.
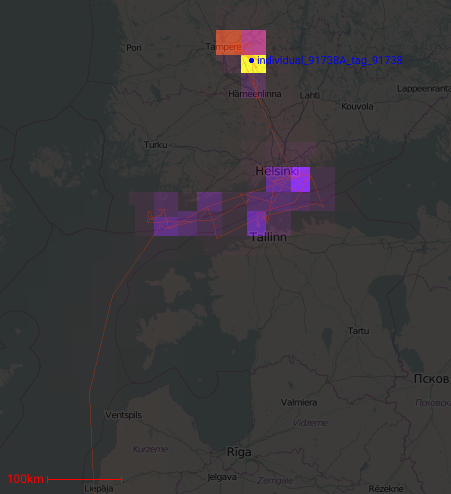
DBBMM
The dynamic brownian bridge movement model provides means to estimate the utility distribution from a set of locations and timestamps. It was originally published by Kranstauber et al., 2012 [1] as a combination of Brownian Bridges (Horne et al., 2007 [2]) and behavioural change pattern estimation (Gurarie et al., 2009 [3]).
Firetail computes the utility distribution for one selected individual via Data > Location and GPS > Calculate DBBMM.
The induced heatmap can be shown by Data > Location and GPS > DBBMM Average Window Variance.
The heatmap and the Average-window-variance sensor-type can be hidden from the map via Data > Clear Overlays.
Kernel Density Map
Location Smoothing
Animal tracks can be smoothed to approximate real-life flight patterns and movement routes.
Each fix is replace by the average of its location and that of its trajectory neighbors. Notably, this feature will displace the current trajectory significantly. It is useful to simulate more natural movement patterns at the cost of actual measurement accuracy.
Outlier Filtering
Movebank outlier definition
Movebank provides the following categories for tagging data outliers that Firetail will interpret as well in the context of csv and Movebank files.
| field | description |
|---|---|
| manually-marked-outlier | manually assigned outliers |
| import-marked-outlier | externally assigned outlier |
| algorithm-marked-outlier | outliers assigned by the Movebank algorithm |
| manually-marked-valid | override outlier assignment (force include) |
Fields that contain one of the following values will be considered true during read-in: {“1”, “true”, “t”, “yes”, “y”}.
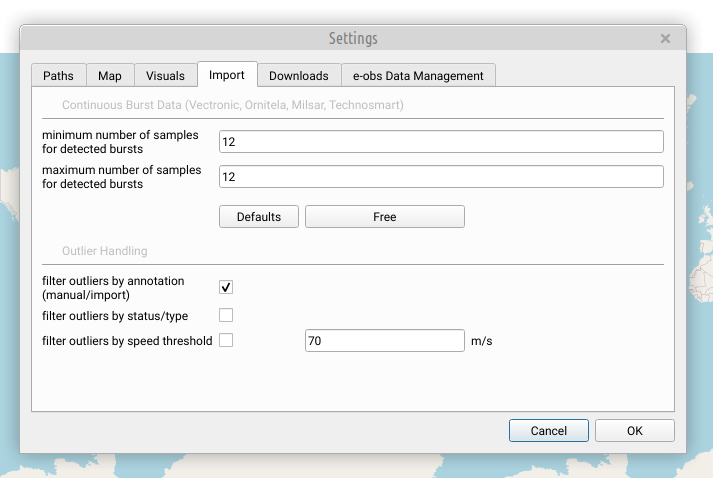
In the Firetail settings, enable the Movebank outlier filter via
File > Settings > Import, then check
filter outliers by annotation (manual/import).
Status/type outliers
Typically, fixes are filtered that differ from
| field | value |
|---|---|
| type-of-fix | 3 |
| status | A |
This option is targeted at e-obs tags and forces the inclusion of filtered measurements. Enable this filter in
File > Settings > Import > Filter Outliers by status/type
Hint: combine this filter with a speed threshold filter or Movebank annotation filters
Speed threshold filter
During read-in, this filter checks for each position if it is reachable from the previous location given a user-defined maximum speed threshold. Enable this filter in
File > Settings > Import > Filter Outliers by speed threshold
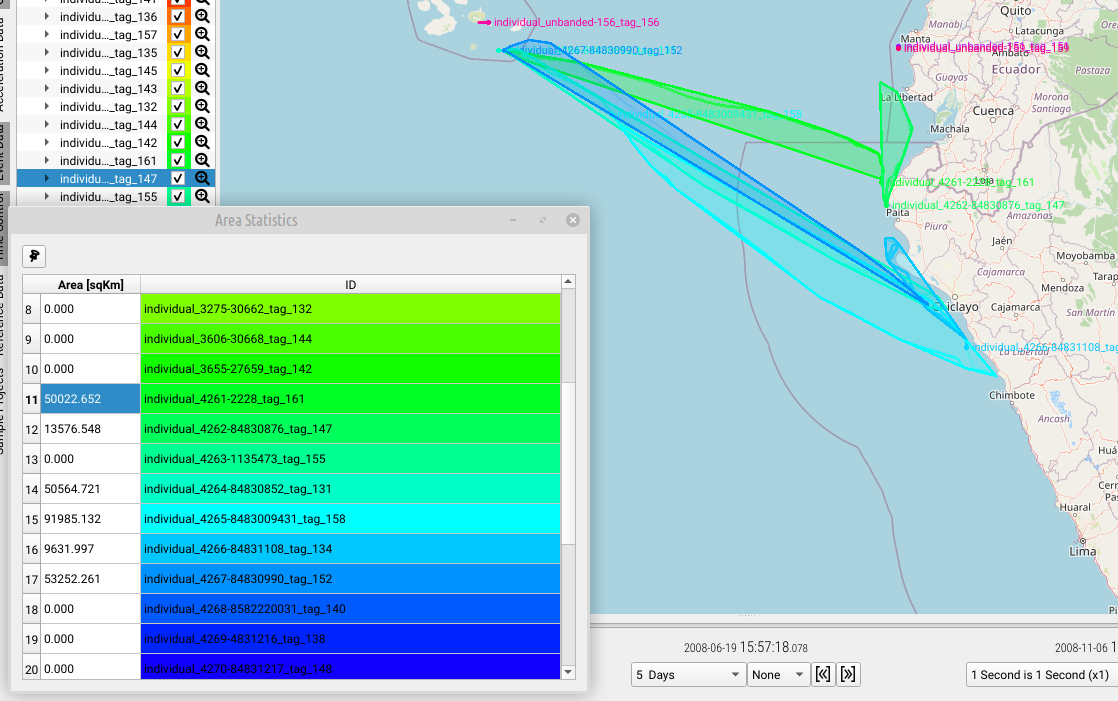
Show Convex Hull
Draw the minimum convex polygon around each grouping (tag/individual/deployment). If a visible region around the current timestamp is selected (dropdown menu below time slider), the induced time window is used to restrict the data.
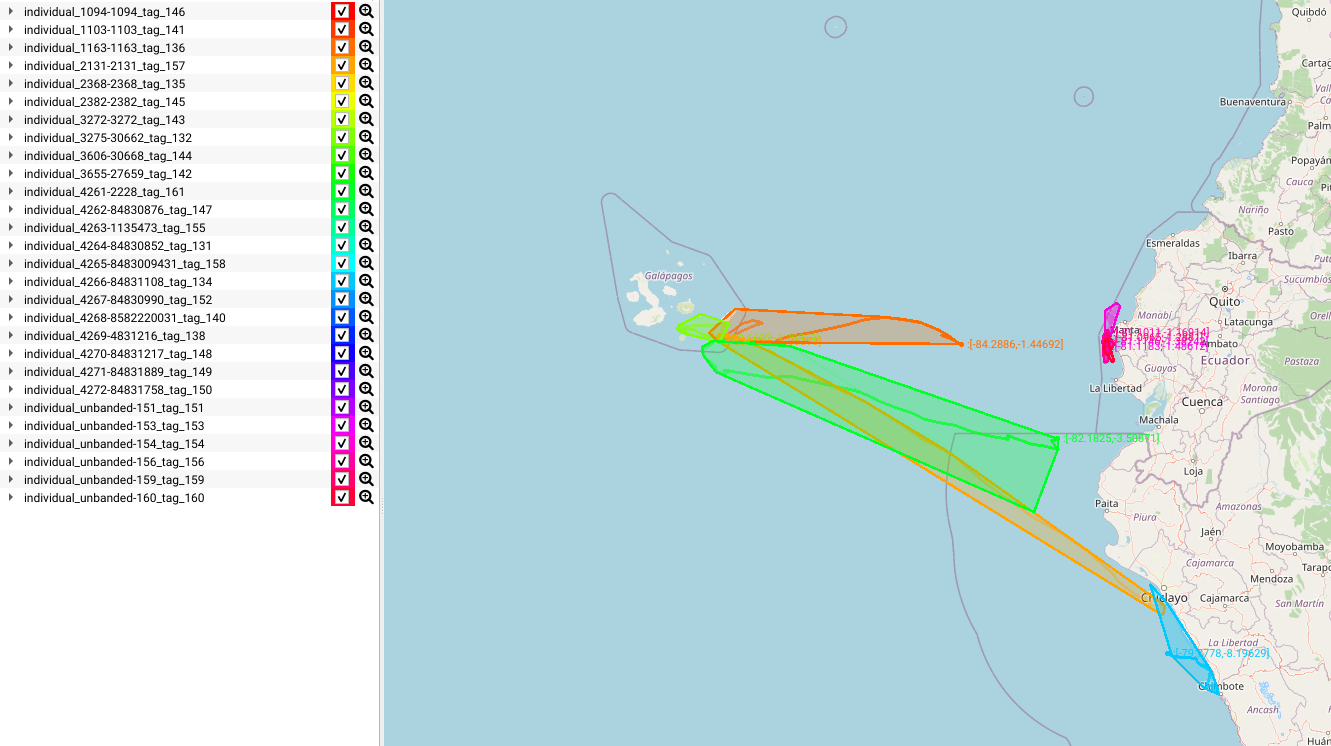
An area statistics window will show the (approximate, no earth-curvature) area of the shown regions for all selected (Open Files) regions.
Overall dynamic body acceleration
Overview
The overall dynamic body acceleration (ODBA) is a measure derived from acceleration data. It can be used to estimate energetic costs of different behaviours, i.e. following Wilson et al. [4] the value is correlated linearly to the oxygen consumption and CO2 production.
Computing ODBA
ODBA can be computed when acceleration data is available.
- Open a project with associated acceleration data
- Select
Data > Acceleration > Compute ODBA
Additional lanes will be shown containing a visual representation of the ODBA results per grouping, i.e. per acceleration source. In addition to the overall mean ODBA the individual axis mean values are shown as well.
Exporting ODBA values
ODBA can be exported along with accelerometer data along with other auxiliary data by
File > Export Annotated Events > Export Acc Bursts as CSV .
One file will be created per grouping (individual/tag/deployment). You’ll be asked where to save each file.
Key steps
Firetail computes the ODBA value as follows:
- calculate a mean acc value for each direction and each burst
- substract the respective mean from each measurement
- sum over the absolute value across all directions
Details
Let \(B\) a burst of \(n\) samples.
A burst sample \(b_i = (x_i, y_i, z_i),\,i=1 \dots n\) holds the respective x, y and z acceleration components.
Given the mean values
\(\overline{x} = \frac{\sum_{i=1}^n{x_i}}{n}\newline{} \overline{y} = \frac{\sum_{i=1}^n{y_i}}{n}\newline{} \overline{z} = \frac{\sum_{i=1}^n{z_i}}{n}\)the overall dynamic body acceleration is then given by
\(ODBA(B) = \sum_{d \in \{x,y,z\}}{|d_i - \overline{d}|}\)A similar value is computed for activity plots.
Activity Value
The activity value is a time-dependent measure summing over the absolute difference of consecutive values in a burst.
Let \(B\) a burst of \(T\) ordered samples in dimensions \(x, y\) and \(z\) .
Activity ACT(B) is then defined as:
\(\text{ACT(B)} = \frac{1}{3 * (T - 1)} \sum_{t=1}^{T} \left( |x_{t-1} - x_{t}| + |y_{t-1} - y_{t}| + |z_{t-1} - z_{t}| \right)\)References
- Kranstauber, B., Kays, R., LaPoint, S. D., Wikelski, M., & Safi, K. (2012). A dynamic Brownian bridge movement model to estimate utilization distributions for heterogeneous animal movement. Journal of Animal Ecology, 81(4), 738-746.
- Horne, J. S., Garton, E. O., Krone, S. M., & Lewis, J. S. (2007). Analyzing animal movements using Brownian bridges. Ecology, 88(9), 2354-2363.
- Gurarie, E., Andrews, R. D., & Laidre, K. L. (2009). A novel method for identifying behavioural changes in animal movement data. Ecology letters, 12(5), 395-408.
- Wilson, R.P., White, C.R., Quintana, F., Halsey, L.G., Liebsch, N., Martin, G.R. & Butler, P.J. (2006) Moving towards acceleration for estimates of activity‐specific metabolic rate in free‐living animals: the case of the cormorant. Journal of Animal Ecology, 75, 1081–1090.