QuickFacts - a fast overview of recent events
Overview
Firetail can show a quick overview of statistics for each individual, summarizing previous events ending with the current timestamp.
QuickFacts are provided for all currently selected individuals in the Open Files panel.
Starting QuickFacts
Use Report > Show QuickFacts to show the interactive statistics window.
Context and step length
The user can define an analysis interval, along with a step length.
For example, when an interval length of 48 hours is chosen, the interval starts 48 hours before the current timestamp
and will end at the current timestamp.
This time range is then divided into equally sized buckets with a user-defined step length,
i.e. |buckets| * step_length = analysis_interval
Parameters
To select the context shown for the selected individuals, use the leftmost dropdown menu (context type).
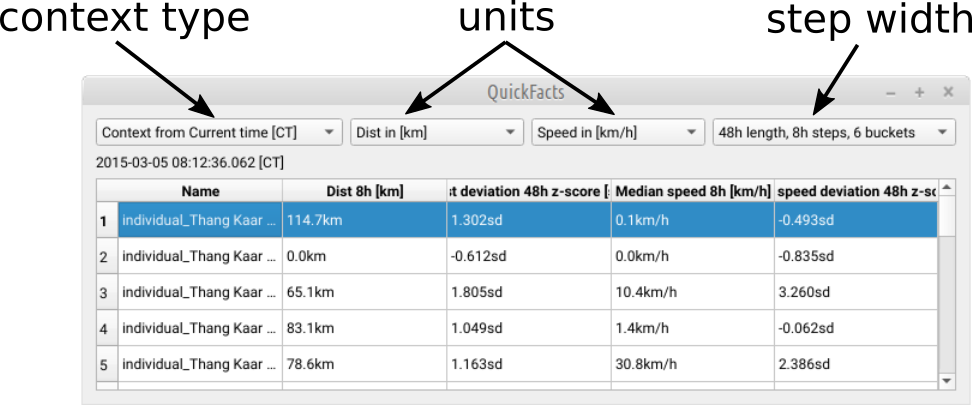
OPTION 1: select context from current time (CT) to create an analysis starting |buckets| * step_length before the current timestamp (ex. 6*8h=48h):
event time --------------------------------------*--------------------------->
                                                 ^current time (as reference)
analysis interval   [48h                         ]
buckets             [   ][   ][   ][   ][   ][   ]
(width: preset)      -48  -40  -32  -24  -16  -8
OPTION 2: select context from selection (SEL) to define the analysis interval from the current selection. The number of buckets then defines the step length.
event time --------------------------------------*--------------------------->
                                                 ^current time (not used)
selection start       [                ] selection end
buckets (width:auto)  [ ][ ][ ][ ][ ][ ]
OPTION 3: select context from bracket interval (BI) to define the analysis interval from the current bracketing (time control). The number of buckets then defines the step length.
event time -----------[--------------------------*-------]------------------->
                                                 ^current time (not used)
        bracket start [                                  ] bracket end
buckets (width:auto)  [    ][    ][    ][    ][    ][    ]
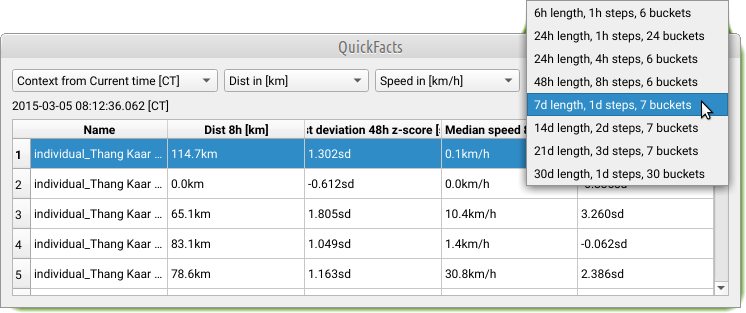
Firetail provides a number of sensible presets for combinations of analysis interval and step length. You can thus focus on either the analysis interval width or the bucket width.
Note: The bucket size should reflect the sampling rate. Each bucket should contain at least 5 samples. Otherwise, the statistics may not be reliable.
| analysis interval | buckets | step length |
|---|---|---|
| 6 hours | 6 | 1h |
| 24 hours | 24 | 1h |
| 24 hours | 6 | 4h |
| 48 hours | 6 | 8h |
| 7 days | 7 | 1d |
| 14 days | 7 | 2d |
| 21 days | 7 | 3d |
| 30 days | 30 | 1d |
Basic statistics are computed for the most recent bucket and Firetail will compare this data to the collected data of all previous buckets.
The following categories are shown in the QuickFacts window:
Distance
- distance traveled during the most recent bucket
- deviation of the distribution of traveled distances from previous buckets in the analysis interval
Speed
- median speed during the most recent bucket
- deviation of the speed distribution from previous buckets in the analysis interval.
Interpreting deviation scores
The deviation scores indicate the deviation of the current bucket distribution from previous buckets in the analysis interval. The deviation unit is a z-score for non-normal distributions (rank scoring, see below).
Herby,
-
a positive deviation score indicates that the current bucket contains values higher than previously seen during the interval,
-
a negative deviation score indicates that the current bucket contains values lower than previously seen during the interval,
-
and a deviation score of near zero indicates that the value is about the same as previously seen during the interval.
Note that strong deviation scores (absolute value over five) can hint at strong differences, but there is no strict implication, in particular when the number of GPS fixes available for each bucket is small or zero. In this case you should increase the analysis interval to include more data to capture more data per bucket.
Caveat: When the analysis interval cannot be expanded to the left (start of data), partial data for the most recent bucket is used. No deviation scores are computed in this case.
The deviation is shown as a z-score derived from a signed Wilcoxon rank sum statistic of the value distribution in the most recent bucket and all other buckets in the analysis interval.
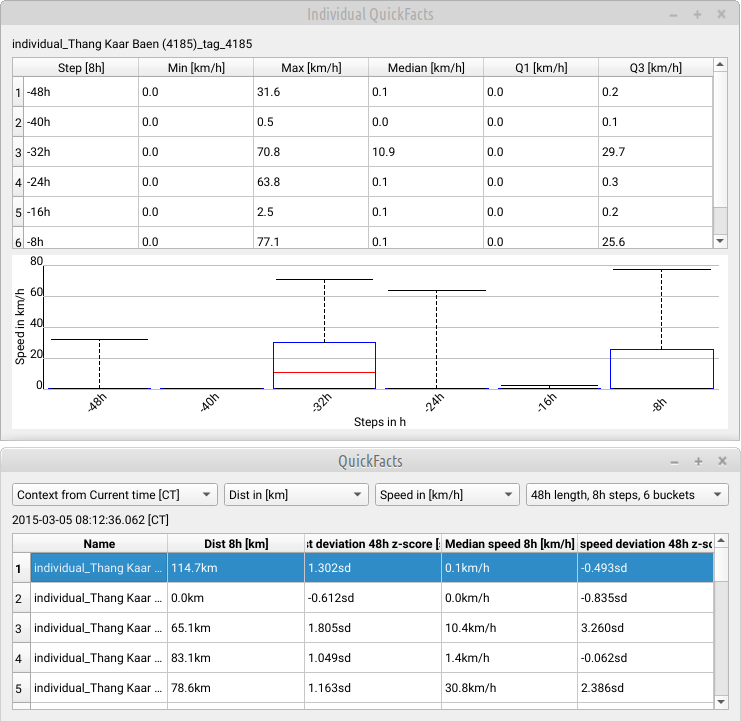
Individual QuickFacts
By clicking on the leading number of an individual you’ll see a QuickFacts window for this individual with detailed information on this entity.
This view provides visual (boxplot) and numerical statistics on recent movements.
Boxplot Viewport
The boxplot represents the speed distribution across all buckets as defined in QuickFacts. The rightmost plot reflects the most recent bucket.
The tabular view provides a numerical summary of the boxplot data.