Map window
Visible Information
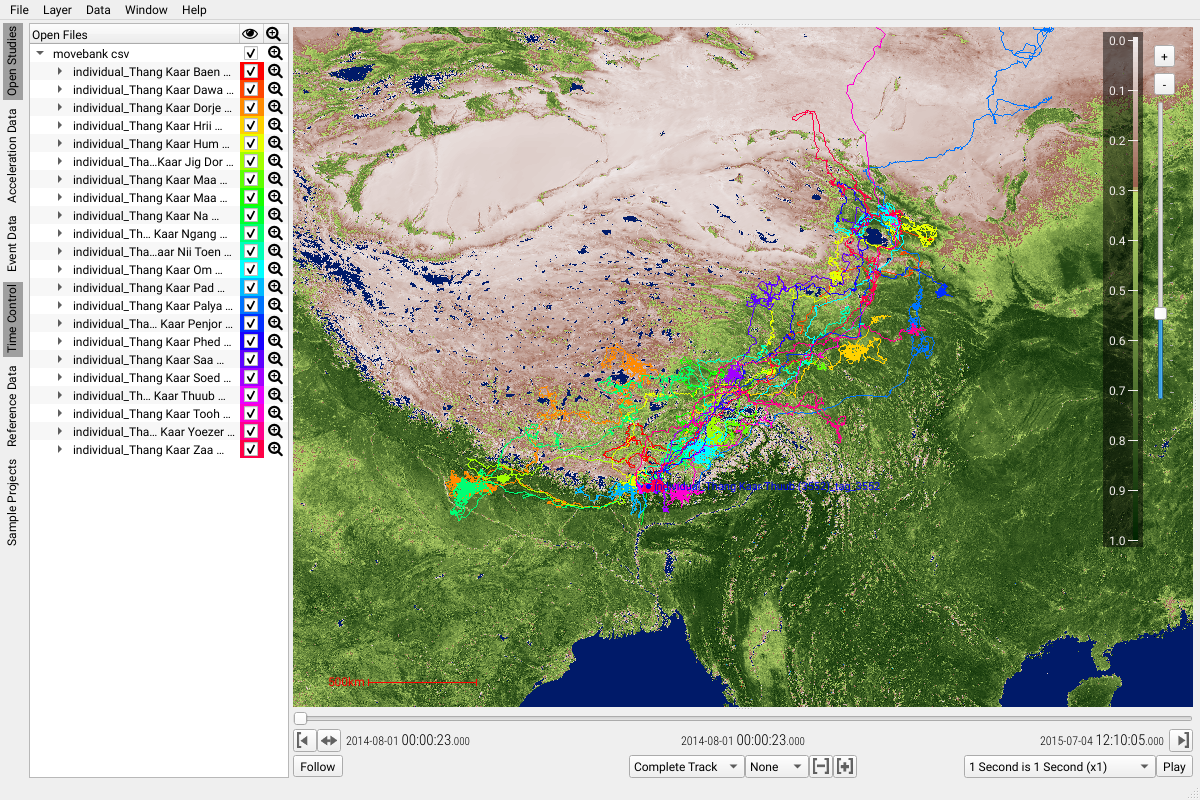
The map gives you an overview over all available and currently selected data sets. Double clicking any visible trajectory will show you the GPS coordinates of all activated (checkboxed) tags having the same timestamp.
Most map features are covered in the respective sections of this manual. The map viewport is directly influenced by:
For acceleration data, it is possible to select consecutive timestamp clusters within the map via shift-<left mouse button>.
In particular, visibility of tracks, covered regions and visible layers are affected by aboves features.
Working with Trajectories
Trajectories are among the key elements of Firetail providing a visual representation (and linear interpolation) of the sensor location over time. Each individual track can be toggled individually, restricted to time brackets (see time control) and much more.
Double Clicking a trajectory shows the assumed individuals position based on a linear interpolation of two
neighboring GPS positions. Keep in mind that, in particular for rough sampling rates, these may not reflect
actual positions.
Bookmarking
see Bookmarking
Closest Distance to Location
To determine the closest in-data location to any point on the map
Double clicka trajectoryDragthe indivdual
This feature is particularly powerful if acceleration data is present which is then centered around this point:
Zoom level
The zoom level is indicated on the top right of the map. The slider can be used to restrict the observed region further.
Note: use your mouse wheel to zoom in and out of the map directly
Offline Data
Firetail (as of v3) allows for the download of map data.
Obviously, an internet connection is required. Navigate to an area that you expect to require during your work
in the field. Then use the menu entry Layer > Download Current Map. A resolution slider allows you to select
tiles up to a user-defined resolution that must be available locally when no internet connection is available.
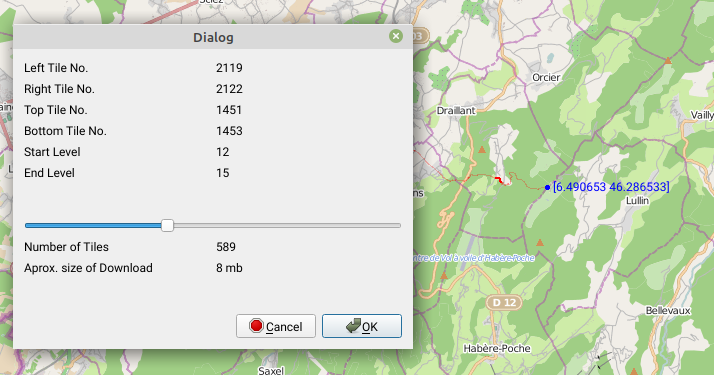
Apart from technical information (tile numbers) you see a Start Level and End Level choice.
The start level is equivalent to the current tile size as shown on your viewport. The end level
is the maximum zoom level that should be made available within the visible area.
Note that map data for large regions can grow quickly even for moderate zoom levels. Therefore we currently limit the batch download to 1GB per selection (the colors will become red and the OK button will become inactive).
Fullscreen mode
Firetail can be used in a fullscreen mode. Press F11 to toggle it, and repeat to
get back to the normal mode.
Video export
Firetail as of version 6 can export the current viewport as mp4 videos at 30fps.
The free edition is limited to 10s videos. The aspect ratio and resolution is identical to the map viewport.
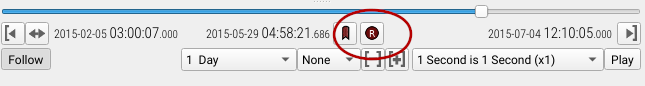
Recording a video:
- Select a start and end point (bracketing) on your timeline, zoom level and tag selection
- Choose replay speed
- Click the red
recordingicon under the map viewport (keyboard shortcut:r) - Select a directory to record your videos in the dialog
- Press
Playto start recording - Use
ror therecordingicon to stop and save the session
A popup should tell you where your result is located.