Acceleration Panel
The acceleration panel provides an overview of burst level data with options to zoom into your dataset or quickly jump to specific timestamps.
Bursts
Modern tags support capturing acceleration data along with location data. As opposed to GPS data, acceleration data is captured as bursts. A burst is a consecutive vector of measurements starting at a specific timestamp. These measurements do not necessarily align to a known GPS position as they are often recorded following a predefined schedule of fixed intervals. Acceleration data captured by tags captures the extent of x, y and z acceleration, quite similar to common smartphones.
Firetail supports you in the analysis of acceleration by visualizing bursts, and matching GPS measurements. Furthermore, Firetail allows to annotate arbitrary labels for user-selected intervals (see Section Burst annotation).
Loading burst data
Downloading data with associated bursts can be done with our integrated Movebank download. Here we show experimental data from the Galapagos Albatrosses study (ID: 2911040), tag 131.
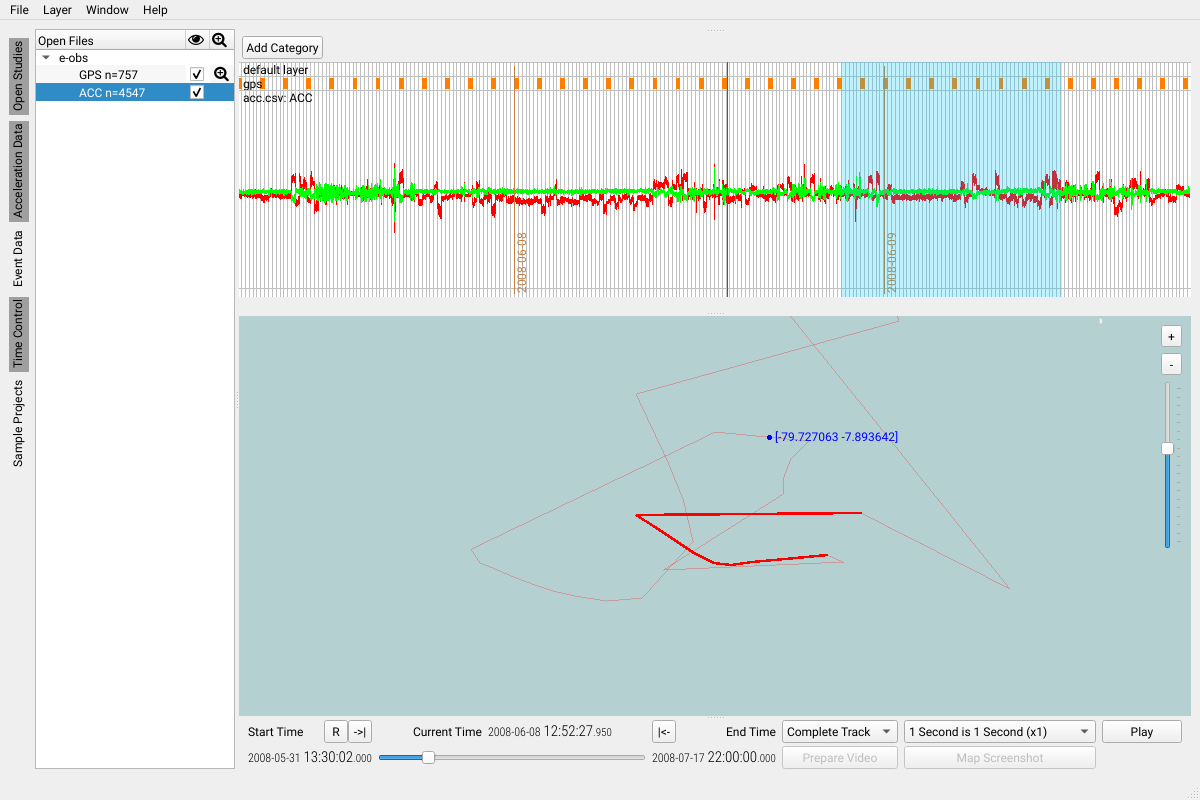
The screenshot above shows a number of bursts selected and highlighted in the map window.
Selecting a burst region
Selecting one or multiple bursts can be done using either by
- a
shift-left mouse button selection on the map - a
shift-left mouse button selection in the acceleration data window
Deselect a region by a single click.
Selecting a burst region via threshold
You can use threshold on event data to select all regions that exceed this threshold.
Use Ctrl-drag in the event data window to select all regions that exceed the
shown threshold.
Use the controls (<= and >) at the top of the event panel to choose if data below <= or above > the
selected threshold should be selected.
Burst annotation
Firetail offers a range of tools for the annotation of bursts with categories and layers. We discuss the details in Section Burst Annotation
Save/Export Data and Annotations
Firetail offers several ways to export annotated data as comma separated values (CSV).
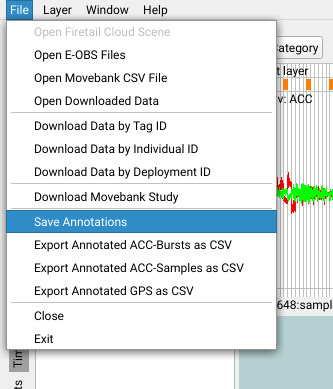
- Select the
Filemenu - Choose one of the available options explained below
Note: if no annotations are available in the current project, exported files will be empty
Save Annotations
This will save the annotations along with the downloaded movebank data. This will preserve your annotations across multiple Firetail sessions (restarts).
ACC bursts as CSV
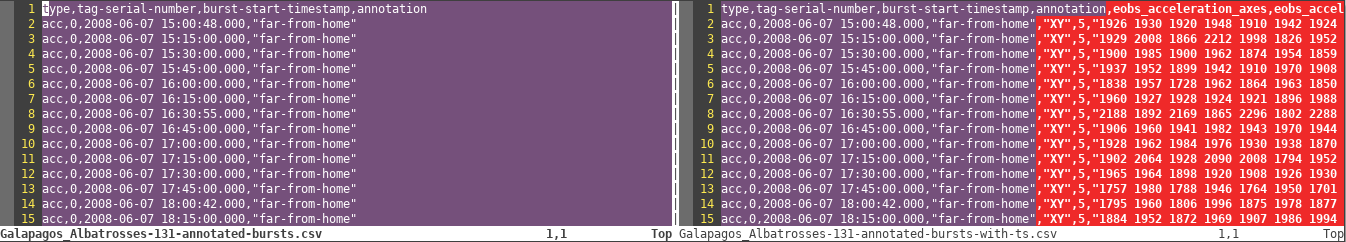
This option will export acc bursts, together with your annotations.
You’ll be asked whether or not to include timestamp data or the start timestamp only. To better understand the difference, see this diff-view of both options:
ACC samples as CSV
This option will export acc samples, together with your annotations.
GPS as CSV
This will export the annotated region as separate track.
Activity Plots
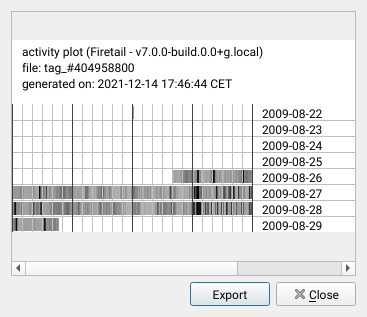
Activity plots provide a fast overview of individual activities over time. Darker areas encode more active phases.
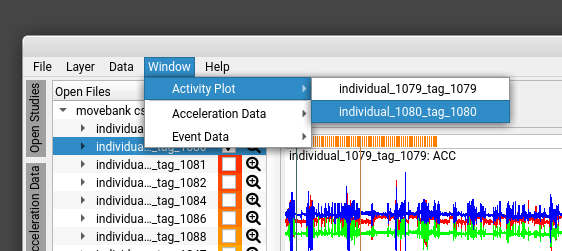
For burst data, you can generate an activity plot for a tag/individual by using
Window > Activity Plot. When acceleration data of multiple individuals is loaded you may
choose which individual should be plotted:
A result could look like this:
Glossary
For technical terms please refer to the incredibly complete Movebank Glossary.