Event data window
Some tags support the recording of event data.
Inspecting event data
If events are available in your dataset you can visually inspect the events by selecting Event Data in the Window Selection Tabs (vertical left).
Alternatively, you may use the menu entry Windows > Event Data to select how to see the event data (top, right, or as floating window).
Note: For larger sets of tags, a selection of subsets is helpful
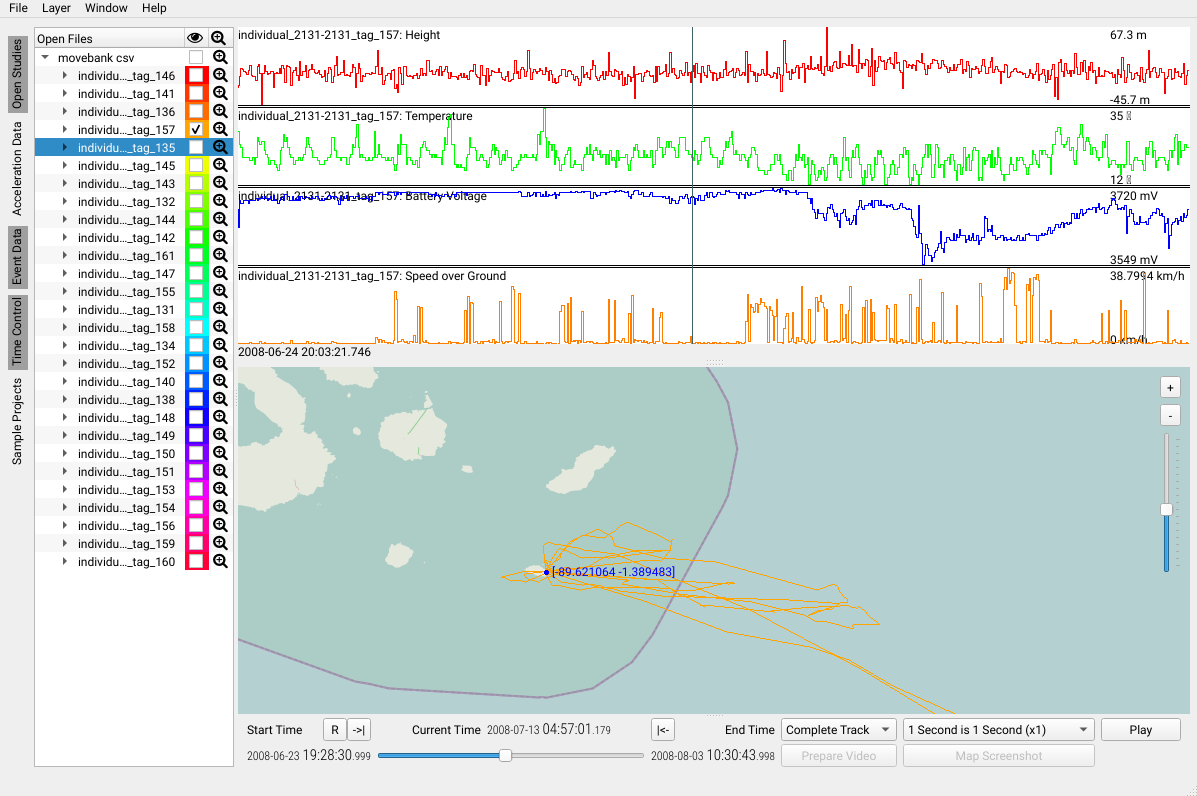
Focus timestamps
It is possible to focus a timestamp in the event data by double clicking in the event window. This will highlight the corresponding events within the map.
A double click selection of a track point on the map will show a vertical bar in the event window that marks the respective timestamp as well.
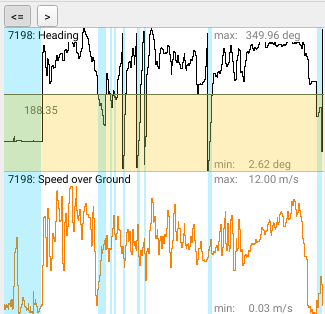
Thresholding
Burst data can be selected via thresholds on the event data
like all data above a given temperature. Use Ctrl-mouse drag within the event windows
to drag a custom threshold. The currently selected value will be shown near a
horizontal bar that marks the threshold (version 4 and above).
Above and below
Use the larger than “>” and smaller equal “<=” buttons to choose if regions below or above a threshold should be selected.