Data Processing
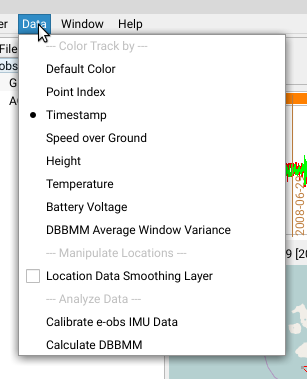
Firetail features a several data processing and data visualisation tools. You can access these features via the Data menu.
Overview
(see below for details)
| Menu Item | Category | Description |
|---|---|---|
| Default Color | Color Track by | Use the default color for the trajectory. |
| Point Index | Color Track by | Highlight timestamps by an equidistant index. Time intervals are neglected. |
| Timestamp | Color Track by | Highlight timestamps with respect to the time intervals among them. |
| Speed over Ground | Color Track by | Highlight each timestamp by measured speed over ground. |
| Height | Color Track by | Color each timestamp relative to its associated height |
| Temperature | Color Track by | Show the measured temperature for each timestamp |
| Battery Voltage | Color Track by | Show the voltage available to the tracking device for each timestamp |
| DBBMM Average Window Variance *) | Color Track by | show the track’s utility distribution calculated from a dynamic Brownian Bridge Movement Model |
| Location Data Smoothing Layer | Manipulate Locations | apply curve smoothing trajectory |
| Calibrate e-obs IMU Data | Analyze Data | calibrate Inertial Measurement Unit data for e-obs tags |
| Calculate DBBMM | Analyze Data | calculate a dynamic Brownian Bridge Movement Model |
*) Requires Calculate DBBMM
Point Index/Timestamp
In the default viewport there no indication is given whether a timestamp has been measured earlier, or later. Using point index or timestamp will visually highlight early (black) points from late (white) measurements. While the point index uses equally distributed colors along the complete track, the timestamp mode will scale the colors according to their distance.
Speed/Height/Temperature/Battery Voltage
The respective attribute is color-coded by its maximal (white) and minimal (black) values for each timestamp.
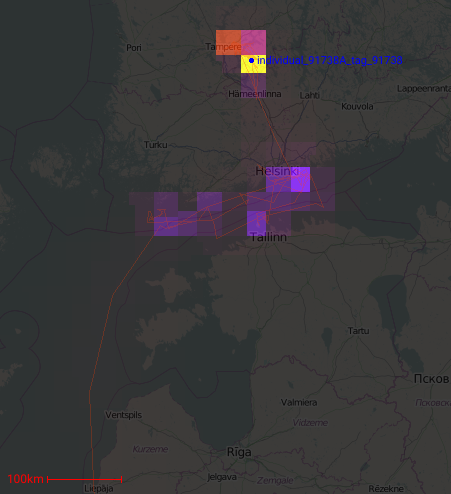
DBBMM
The dynamic brownian bridge movement model provides means to estimate the utility distribution from a set of locations and timestamps. It was originally published by Kranstauber et al., 2012 [1] as a combination of Brownian Bridges (Horne et al., 2007 [2]) and behavioural change pattern estimation (Gurarie et al., 2009 [3]).
Firetail computes the utility distribution for one selected individual via Data > Calculate DBBMM.
The induced heatmap can be shown by Data > DBBMM Average Window Variance.
The heatmap and the Average-window-variance sensor-type can be hidden from the map via Data > Clear DBBMM.
Location Smoothing
Animal tracks can be smoothed to approximate real-life flight patterns and movement routes. Notably, this feature may displace the current trajectory significantly. It is useful to simulate more natural patterns at the cost of actual measurement accuracy.
Overall dynamic body acceleration
Overview
The overall dynamic body acceleration (ODBA) is a measure derived from acceleration data. It can be used to estimate energetic costs of different behaviours, i.e. following Wilson et al. [4] the value is correlated linearly to the oxygen consumption and CO2 production.
Key steps
Firetail computes the ODBA value as follows:
- calculate a mean acc value for each direction and each burst
- substract the respective mean from each measurement
- sum over the absolute value across all directions
Details
Let \(B\) a burst of \(n\) samples.
A burst sample \(b_i = (x_i, y_i, z_i),\,i=1 \dots n\) holds the respective x, y and z acceleration components.
Given the mean values
\(\overline{x} = \frac{\sum_{i=1}^n{x_i}}{n}\newline{} \overline{y} = \frac{\sum_{i=1}^n{y_i}}{n}\newline{} \overline{z} = \frac{\sum_{i=1}^n{z_i}}{n}\)the overall dynamic body acceleration is then given by
\(ODBA(B) = \sum_{d \in \{x,y,z\}}{|d_i - \overline{d}|}\)References
- Kranstauber, B., Kays, R., LaPoint, S. D., Wikelski, M., & Safi, K. (2012). A dynamic Brownian bridge movement model to estimate utilization distributions for heterogeneous animal movement. Journal of Animal Ecology, 81(4), 738-746.
- Horne, J. S., Garton, E. O., Krone, S. M., & Lewis, J. S. (2007). Analyzing animal movements using Brownian bridges. Ecology, 88(9), 2354-2363.
- Gurarie, E., Andrews, R. D., & Laidre, K. L. (2009). A novel method for identifying behavioural changes in animal movement data. Ecology letters, 12(5), 395-408.
- Wilson, R.P., White, C.R., Quintana, F., Halsey, L.G., Liebsch, N., Martin, G.R. & Butler, P.J. (2006) Moving towards acceleration for estimates of activity‐specific metabolic rate in free‐living animals: the case of the cormorant. Journal of Animal Ecology, 75, 1081–1090.