
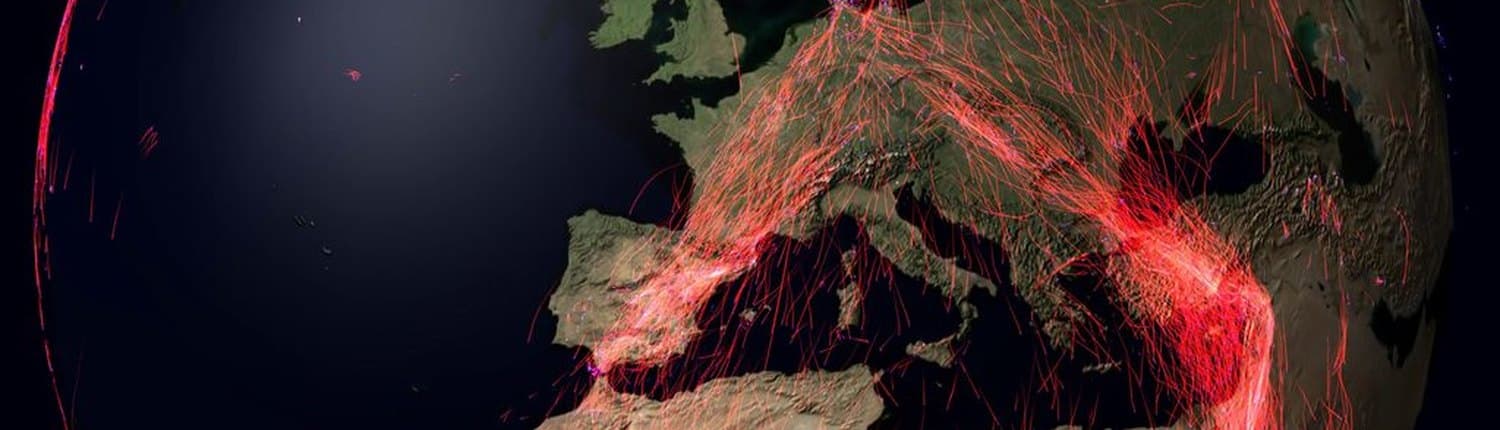
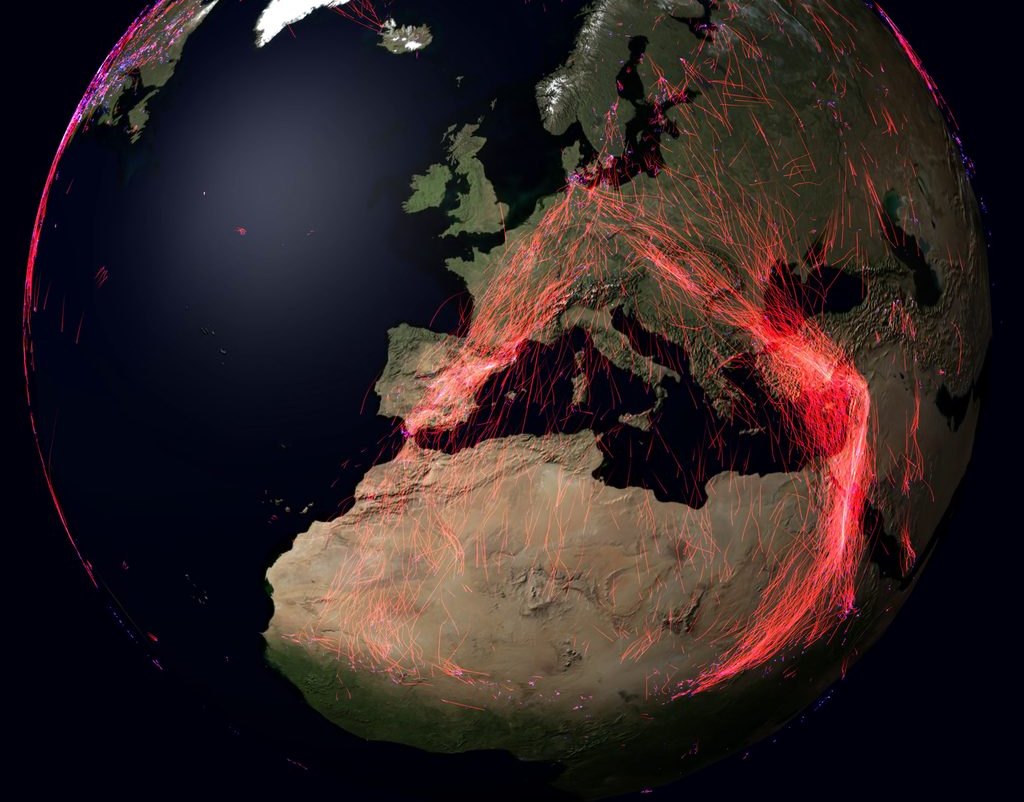
Tens of thousands of animal tracks on one globe, a year of migration in ninety seconds: that is the kind of work we love. Matthias Berger's animations of Movebank data have been shown on television, printed in books and exhibited at the Frankfurter Kunstverein. We make the same kind of pictures from your data.
What we make
- Animations of large datasets. Millions of data points rendered as a film: for outreach, press, documentaries, exhibitions and talks. In 4K, as a loop for a museum screen, as a vertical cut for social media, or as stills for print.
- Animations for science. Movement data shown together with what drives it (wind, terrain, food, depth), as supplementary material for a paper or to explain a method in a talk.
- Interactive visualizations. Tools in which your team explores its own data: zoom from the globe down to a single fix, scrub through time, compare individuals or sensors side by side.
- Visualization inside analysis software. Views that make a dataset understandable at a glance, built into desktop or web applications. Our own product Firetail shows GPS tracks, accelerometer data and behaviour of many animals on one timeline.
Selected work
- Global animal migration (2017–2023). Every publicly shared long-distance track on Movebank, laid on one globe and one year. Featured by The Verge and El País, shown in the NDR documentary Erlebnis Erde, in the exhibition Bending the Curve at the Frankfurter Kunstverein and in several books. The story and where it has appeared.
- Animations for research papers. Penguins in 3D with their dive profiles, Galapagos albatrosses against wind and ocean chlorophyll, wind estimated from the thermal soaring of white storks: see the list below.
- Firetail. Our analysis software for animal tracking data: large GPS datasets and high-frequency accelerometer data, interactive, on Windows, macOS and Linux. firetail.de
- ISS simulation. The International Space Station passing over GPS-tagged storks, with the station's visible horizon: a simulation of how the ICARUS system detects and talks to tags on the ground. Video
- Movebank Zoom and "all public studies". How much detail sits in a global tracking database: from the whole map to a single track, and the map filling up study by study. Zoom, studies
In publications
Research papers
- Masello, J. F., Mundry, R., Poisbleau, M., Demongin, L., Voigt, C. C., Wikelski, M. & Quillfeldt, P. (2010). Diving
seabirds share foraging space and time within and among species. Ecosphere 1: art19.
doi:10.1890/ES10-00103.1. Six animations published as Appendices B–G, each with its own DOI:
- all four species: doi:10.1890/ES10-00103.2, YouTube
- Rockhopper penguins: doi:10.1890/ES10-00103.3, YouTube
- Magellanic penguins: doi:10.1890/ES10-00103.4, YouTube
- Gentoo penguins: doi:10.1890/ES10-00103.5, YouTube
- Imperial shags: doi:10.1890/ES10-00103.6, YouTube
- 3D with dive profiles: doi:10.1890/ES10-00103.7, YouTube
- Dodge, S., Bohrer, G., Weinzierl, R., Davidson, S. C., Kays, R., Douglas, D., Cruz, S., Han, J., Brandes, D. & Wikelski, M. (2013). The Environmental-Data Automated Track Annotation (Env-DATA) System: linking animal tracks with environmental data. Movement Ecology 1: 3. doi:10.1186/2051-3933-1-3. Accompanying animation: Galapagos albatrosses, wind and ocean chlorophyll (YouTube).
- Weinzierl, R., Bohrer, G., Kranstauber, B., Fiedler, W., Wikelski, M. & Flack, A. (2016). Wind estimation based on thermal soaring of birds. Ecology and Evolution 6(24): 8706–8718. doi:10.1002/ece3.2585. Animation based on the paper's data and method (YouTube).
Books
- Shah, S. (2020). The Next Great Migration: The Beauty and Terror of Life on the Move. Cites the 2017 migration animation.
- Cabanes, V., Chapelle, G. & Simon, M. (2021). Tout tourne rond sur cette Terre, nous sommes les seuls à… (French). Describes the migration animation.
- Wikelski, M., Müller, U. & Ziegler, C. (2022). Das ICARUS Projekt. National Geographic Deutschland. ISBN 978-3-86690-816-1. Full-page still from the migration animation.
TV, press and exhibitions: where the migration animation has appeared.
How a project runs
- Your data and your question. What should the audience see, feel or understand? We look at the data first: its size, resolution, gaps and quirks.
- Concept and test render. A short draft on your real data, so you can judge the look before anything is final.
- Production. Rendering in the formats you need, with the credits and sources you need.
- Handover. Video files, stills, or the software itself, so you can run it again on next year's data.
We write the rendering software ourselves (Java/OpenGL, C++/Qt, web), so we are not limited to what an off-the-shelf tool can draw.
An example of the work behind a picture: for the 2023 migration animation we processed 421 GB of Movebank location data and reduced it to a 909 MB dataset of about 46,500 tracks for the renderer. About 90% of the outliers were removed automatically; for the rest, an in-house tool searched the whole public dataset, and about 250 tracks were removed by hand. The making-of on X.
Using our existing animations
Our animations can be licensed for documentaries, books, exhibitions and teaching. Every use carries a credit line naming the author. Ask us about formats and terms.
Your data, made visible
Do you have movement, sensor or geodata that deserves more than a chart? Get in touch.